Oddity in "atlas-probe-traffic" measurement data/graph

Hi, Probes report the traffic volume they see on the device's/machine's interfaces in built-in measurement #9002 (on software probes, this needs to be enabled manually for privacy reasons). I use that to keep an eye on the behavior/health of the probe's host machine via the graphs generated by RIPEstat, which works well most of the time. Sometimes, however, there is an oddity in the data, namely extreme outliers. See attached graph, showing a peak of greater than 6.6 Gbps, when the "normal" traffic rarely exceeds 2Mbit/s. The underlying data shows an unusual high amount of bytes/packets sent/received for one instant that is pretty much impossible, here the data points around the anomaly (from [1]): [...] { "timestamp": 1736330734, "bytes_recv": 70881.58333333333, "bytes_sent": 63566.92222222222, "packets_recv": 737.8166666666667, "packets_sent": 700.6, "interfaces": [ "eth0" ] }, { "timestamp": 1736330921, "bytes_recv": 925866981.9732621, "bytes_sent": 820879052.6524065, "packets_recv": 8351935.347593583, "packets_sent": 8177239.866310161, "interfaces": [ "eth0" ] }, { "timestamp": 1736331101, "bytes_recv": 106008.85555555555, "bytes_sent": 88055.43333333333, "packets_recv": 1100.5944444444444, "packets_sent": 971.6666666666666, "interfaces": [ "eth0", "he-ipv6" ] }, [...] I think I've seen similar behavior on all of my software probes at one time or another, don't recall whether this also previously occured with my HW probe. So far, I have not been able to manually reproduce this, but it seems this is typically related to issues in communication with the controller, be it something on the controller side, like was more frequent/pronounced during the migration to the new controller infrastructure. Be it something on the probe side, e.g., temporary issue in network stack configuration. My current hypothesis is that when the probe cannot send off the measurement data, the accumulated data _for this particular measurement type_ is somehow getting corrupted, and the corrupted data is then sent once the communication issues are resolved, and data upload resumes. E.g., in this case, from the logs, it looks as if a reregistration with the controller was being done during minute 10:08, with the measurement data for #9002 taken just when the re-registration started. Not sure whether that is just coincidence, or whether there is a causal relation between the two. Anyone else seeing something similar, occasionally at least? Any idea what might be going on? (Have not gotten too far yet scouring through the probe/measurement code to see whether that yields any hints.) Thanks! R. [1] https://stat.ripe.net/data/atlas-probe-traffic/data.json?probe_id=1008486&me...
Looks like this affects anchors as well, see attached screenshot. On 08.01.25 20:02, ripe@nurfuerspam.de wrote:
Hi,
Probes report the traffic volume they see on the device's/machine's interfaces in built-in measurement #9002 (on software probes, this needs to be enabled manually for privacy reasons). I use that to keep an eye on the behavior/health of the probe's host machine via the graphs generated by RIPEstat, which works well most of the time.
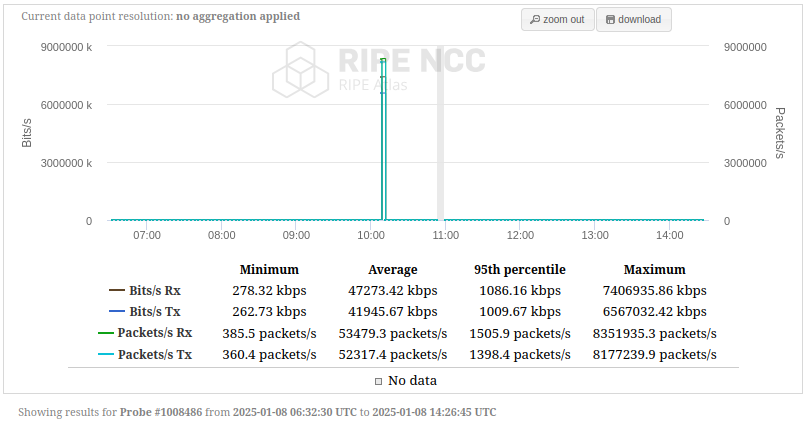
Sometimes, however, there is an oddity in the data, namely extreme outliers. See attached graph, showing a peak of greater than 6.6 Gbps, when the "normal" traffic rarely exceeds 2Mbit/s.
The underlying data shows an unusual high amount of bytes/packets sent/ received for one instant that is pretty much impossible, here the data points around the anomaly (from [1]):
[...] { "timestamp": 1736330734, "bytes_recv": 70881.58333333333, "bytes_sent": 63566.92222222222, "packets_recv": 737.8166666666667, "packets_sent": 700.6, "interfaces": [ "eth0" ] }, { "timestamp": 1736330921, "bytes_recv": 925866981.9732621, "bytes_sent": 820879052.6524065, "packets_recv": 8351935.347593583, "packets_sent": 8177239.866310161, "interfaces": [ "eth0" ] }, { "timestamp": 1736331101, "bytes_recv": 106008.85555555555, "bytes_sent": 88055.43333333333, "packets_recv": 1100.5944444444444, "packets_sent": 971.6666666666666, "interfaces": [ "eth0", "he-ipv6" ] }, [...]
I think I've seen similar behavior on all of my software probes at one time or another, don't recall whether this also previously occured with my HW probe.
So far, I have not been able to manually reproduce this, but it seems this is typically related to issues in communication with the controller, be it something on the controller side, like was more frequent/pronounced during the migration to the new controller infrastructure. Be it something on the probe side, e.g., temporary issue in network stack configuration.
My current hypothesis is that when the probe cannot send off the measurement data, the accumulated data _for this particular measurement type_ is somehow getting corrupted, and the corrupted data is then sent once the communication issues are resolved, and data upload resumes.
E.g., in this case, from the logs, it looks as if a reregistration with the controller was being done during minute 10:08, with the measurement data for #9002 taken just when the re-registration started. Not sure whether that is just coincidence, or whether there is a causal relation between the two.
Anyone else seeing something similar, occasionally at least? Any idea what might be going on? (Have not gotten too far yet scouring through the probe/measurement code to see whether that yields any hints.)
Thanks!
R.
[1] https://stat.ripe.net/data/atlas-probe-traffic/data.json? probe_id=1008486&measurement_id=9002&starttime=2025-01-08T09:51:49&endtime=2025-01-08T10:15:32&resolution=0&display_mode=condensed

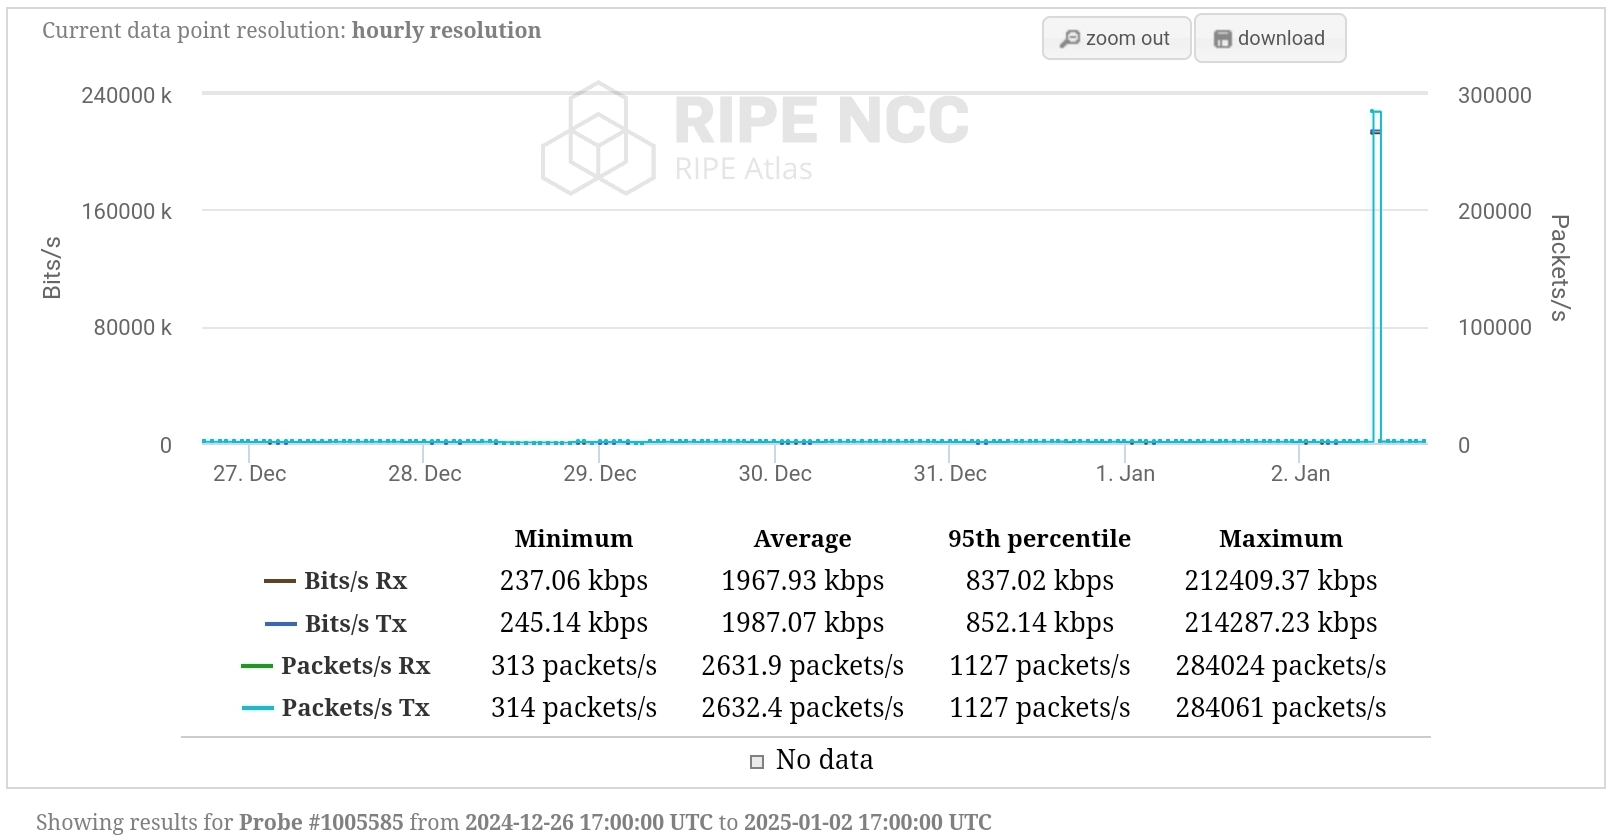
Hello, Thank you for this analysis. The traffic reporting is not a count of what the measurement code sends and receives; rather it is just reading the values from the network interface counters and reporting those. (This is also why such reporting is opt-in for software probes: there may be unrelated activity on the same device that should not be reported). Based on the information you collected it seems there may be a bug somewhere when these values are reported around disconnections. Perhaps the reports are sent out-of-order which confuses the calculation. The values you see are certainly not "reasonable" but the code doesn't know that :-) We'll check if we can improve error handling here; in the meantime please consider these cases anomalies. Note that we're working on phasing out the RIPEstat related traffic widgets. The data will still be available to you. Depending on where the bug is (if there's one) this may solve this case as well. Regards, Robert On Fri, Jan 24, 2025 at 12:19 PM via ripe-atlas <ripe-atlas@ripe.net> wrote:
Looks like this affects anchors as well, see attached screenshot.
On 08.01.25 20:02, ripe@nurfuerspam.de wrote:
Hi,
Probes report the traffic volume they see on the device's/machine's interfaces in built-in measurement #9002 (on software probes, this needs to be enabled manually for privacy reasons). I use that to keep an eye on the behavior/health of the probe's host machine via the graphs generated by RIPEstat, which works well most of the time.
Sometimes, however, there is an oddity in the data, namely extreme outliers. See attached graph, showing a peak of greater than 6.6 Gbps, when the "normal" traffic rarely exceeds 2Mbit/s.
The underlying data shows an unusual high amount of bytes/packets sent/ received for one instant that is pretty much impossible, here the data points around the anomaly (from [1]):
[...] { "timestamp": 1736330734, "bytes_recv": 70881.58333333333, "bytes_sent": 63566.92222222222, "packets_recv": 737.8166666666667, "packets_sent": 700.6, "interfaces": [ "eth0" ] }, { "timestamp": 1736330921, "bytes_recv": 925866981.9732621, "bytes_sent": 820879052.6524065, "packets_recv": 8351935.347593583, "packets_sent": 8177239.866310161, "interfaces": [ "eth0" ] }, { "timestamp": 1736331101, "bytes_recv": 106008.85555555555, "bytes_sent": 88055.43333333333, "packets_recv": 1100.5944444444444, "packets_sent": 971.6666666666666, "interfaces": [ "eth0", "he-ipv6" ] }, [...]
I think I've seen similar behavior on all of my software probes at one time or another, don't recall whether this also previously occured with my HW probe.
So far, I have not been able to manually reproduce this, but it seems this is typically related to issues in communication with the controller, be it something on the controller side, like was more frequent/pronounced during the migration to the new controller infrastructure. Be it something on the probe side, e.g., temporary issue in network stack configuration.
My current hypothesis is that when the probe cannot send off the measurement data, the accumulated data _for this particular measurement type_ is somehow getting corrupted, and the corrupted data is then sent once the communication issues are resolved, and data upload resumes.
E.g., in this case, from the logs, it looks as if a reregistration with the controller was being done during minute 10:08, with the measurement data for #9002 taken just when the re-registration started. Not sure whether that is just coincidence, or whether there is a causal relation between the two.
Anyone else seeing something similar, occasionally at least? Any idea what might be going on? (Have not gotten too far yet scouring through the probe/measurement code to see whether that yields any hints.)
Thanks!
R.
[1] https://stat.ripe.net/data/atlas-probe-traffic/data.json?
probe_id=1008486&measurement_id=9002&starttime=2025-01-08T09:51:49&endtime=2025-01-08T10:15:32&resolution=0&display_mode=condensed ----- To unsubscribe from this mailing list or change your subscription options, please visit: https://mailman.ripe.net/mailman3/lists/ripe-atlas.ripe.net/ As we have migrated to Mailman 3, you will need to create an account with the email matching your subscription before you can change your settings. More details at: https://www.ripe.net/membership/mail/mailman-3-migration/
participants (2)
-
 ripe@nurfuerspam.de
 -
 Robert Kisteleki